Dynamics 365 | Power BI
Explores, analyzes and communicates information effectively
Power BI Specialists
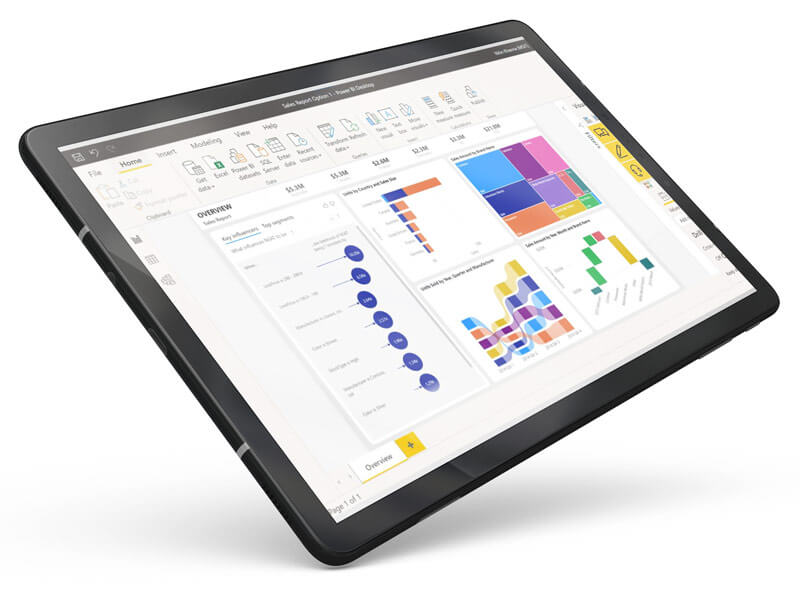
What is Power BI?
There is no point in having a lot of information and not knowing exactly what to do with it. Power BI is a platform that brings data to life.
It consists of an analysis software/platform that allows you not only to store relevant business information in the cloud but also to generate interactive reports and various reports, thus facilitating the understanding and analysis of the information.
It can analyze large volume of data and segment it, as well as offer the possibility of customizing it according to convenience, so that it can be presented graphically. A highly effective proposal based on the innovative concept of business intelligence management.
Request for a consultation today:
Betting on the benefits of Power BI integrated into
your Business Central
Ranked as one of the most trusted analytics solutions in the industry.
Accurate analysis:
Power BI is responsible for accurately assessing information. Take advantage of this resource to get ahead of problems.
Strategic data blending:
It is compatible with Dynamics 365 Business Central.
Immediate access:
The data is available in the cloud and you can access it whenever you need it.
More than just numbers:
Power BI platform sorts the information and displays it in a visual form for easy understanding and sharing with work teams.
KPI:
You will learn about key performance indicators that will be presented in interactive dashboards according to the specific variables you select.
Power BI for every department in the company
This tool has been specifically designed to comprehensively analyse different areas within the business structure.
> Sales
Allows tracking the effectiveness of sales activities of a product or service. With the possibility of generating future projections.
Indicators on the efficiency of daily operations, following table provides a summary of the data, order flow and comparisons with the inventory.
Helps verify profit and loss according to the selected frequency, daily, weekly, quarterly or yearly.
Comparing sales processes- brand reach, number of potential customers registered, return on investment and many more.
If you want to learn more about Power BI and how we can integrate it into your processes, CONTACT US NOW and discover the difference